Published on 05/18/2017 | Technology

A recent argument with folks whose intelligence I hold in high regard (like Tom, Brandon, Wei, Anil, etc.) got me thinking about the following question:
What does it mean, as a vendor, to say that you support the Internet of Things (IOT) from an analytics perspective?
I think the heart of that question really boils down to this:
What are the differences between big data (which is analyzing large amounts of mostly human-generated data to support longer-duration use cases such as predictive maintenance, capacity planning, customer 360 and revenue protection) and IOT (which is aggregating and compressing massive amounts of low latency / low duration / high volume machine-generated data coming from a wide variety of sensors to support real-time use cases such as operational optimization, real-time ad bidding, fraud detection, and security breach detection)?
I don’t believe that loading sensor data into a data lake and performing data science to create predictive analytic models qualifies as doing IOT analytics. To me, that’s just big data (and potentially REALLY BIG DATA with all that sensor data). In order for one to claim that they can deliver IOT analytic solutions requires big data (with data science and a data lake), but IOT analytics must also include:
If you cannot manage real-time streaming data and make real-time analytics and real-time decisions at the edge, then you are not doing IOT or IOT analytics, in my humble opinion. So what is required to support these IOT data management and analytic requirements?
The IOT “Analytics” Challenge
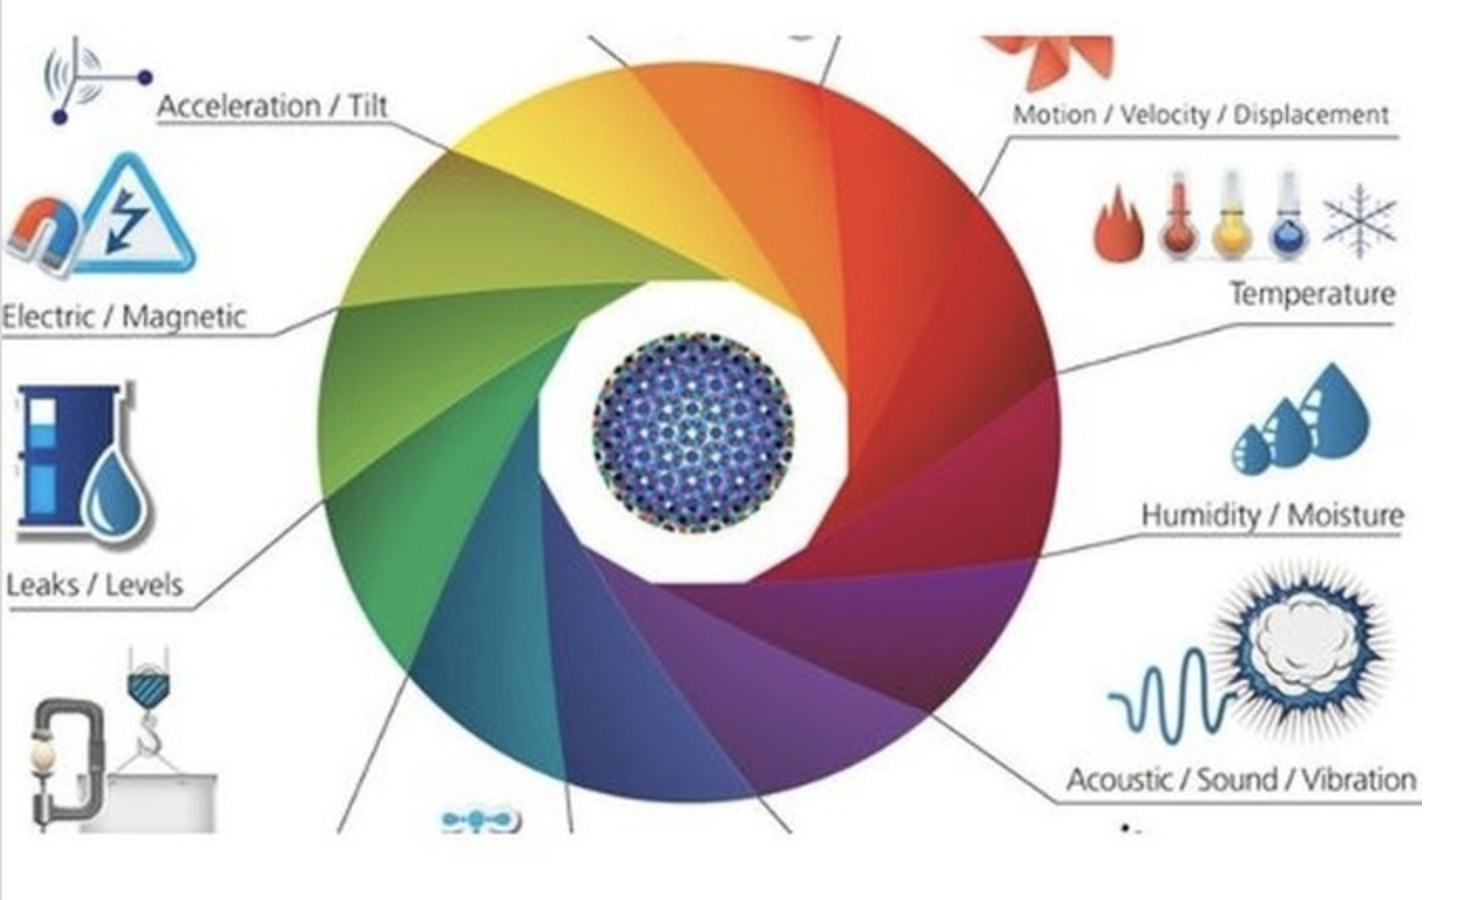
The Internet of Things (or Industrial Internet) operates at machine-scale, by dealing with machine-to-machine generated data. This machine-generated data creates discrete observations (e.g., temperature, vibration, pressure, humidity) at very high signal rates (1,000s of messages/sec). Add to this the complexity that the sensor data values rarely change (e.g., temperature operates within an acceptably small range). However, when the values do change the ramifications, the changes will likely be important.
Consequently to support real-time edge analytics, we need to provide detailed data that can flag observations of concern, but then doesn’t overwhelm the ability to get meaningful data back to the core (data lake) for more broad-based, strategic analysis.
One way that we see organizations addressing the IOT analytics needs is via a 3-tier Analytics Architecture (see Figure 1).

Figure 1: IOT Analytics 3-Tier Architecture
We will use a wind turbine farm to help illustrate the 3-tier analytics architecture capabilities.
Tier 1 performs individual wind turbine real-time performance analysis and optimization. Tier 1 must manage (ingest and compress) real-time data streams coming off of multiple, heterogeneous sensors. Tier 1 analyzes the data, and processes the incoming data against static or dynamically updated analytic models (e.g., rules-based, decision trees) for immediate or near-immediate actions.
Purpose-built T1 edge gateways leverage real-time data compression techniques (e.g., see the article “timeseries storage and data compression” for more information on timeseries databases) to only send a subset of the critical data (e.g., data that has changed) back to T2 and T3 (core).
Let’s say that you are monitoring the temperatures of a compressor inside of a large industrial engine. Let’s say the average temperature of that compressor is 99 degrees, and only varies between 98 to 100 degrees within a 99% confidence level. Let’s also say the compressor is emitting the following temperature readings 10 times a second:
99, 99, 99, 98, 98, 99, 99, 98, 99, 99, 100, 99, 99, 99, 100, 99, 98, 99, 99…
You have 10,000 of readings that don’t vary from that range. So why send all of the readings (which from a transmission bandwidth perspective could be significant)? Instead, use a timeseries database to only send mean, medium, mode, variances, standard deviation and other statistical variables of the 10,000 readings instead of the individual 10,000 readings.
However, let’s say that all of a sudden we start getting readings outside the normal 99% confidence level:
99, 99, 99, 100, 100, 101, 101, 102, 102, 103, 104, 104, 105, …
Then we’d apply basic Change Data Capture (CDC) techniques to capture and transmit the subset of critical data to T2 and T3 (core).
Consequently, edge gateways leverage timeseries compression techniques to drive faster automated decisions while only sending a subset of critical data to the core for further analysis and action.
The Tier 1 analytics are likely being done via an on-premise analytics server or gateway (see Figure 2).

Figure 2: IOT Tier 1 Analytics
Tier 2 optimizes performance and predicts maintenance needs across the wind turbines in the same wind farm. Tier 2 requires a distributed dynamic content processing rule generation and execution analytics engine that integrates and analyzes data aggregated across the potentially heterogeneous wind turbines. Cohort analysis is typical in order to identify, validate and codify performance problems and opportunities across the cohort wind turbines. For example, in the wind farm, the Tier 2 analytics are responsible for real-time learning that can generate the optimal torque and position controls for the individual wind turbines. Tier 2 identifies and shares best practices across the wind turbines in the wind farm without having to be dependent upon the Tier 3 core analytics platform (see Figure 3).

Figure 3: Tier 2 Analytics: Optimizing Cohort Performance
Tier 3 is the data lake enabled core analytics platform. The tier 3 core analytics platform includes analytics engines, data sets and data management services (e.g., governance, metadata management, security, authentication) that enable access to the data (sensor data plus other internal and external data sources) and existing analytic models that supports data science analytic/predictive model development and refinement. Tier 3 aggregates the critical data across all wind farms and individual turbines, and combines the sensor data with external data sources which could include weather (humidity, temperatures, precipitation, air particles, etc.), electricity prices, wind turbine maintenance history, quality scores for the wind turbine manufacturers, and performance profiles of the wind turbine mechanics and technicians (see Figure 4).

Figure 4: Core Analytics for Analytic Model Development and Refinement
With the rapid increase in storage and processing power at the edges of the Internet of Things (for example, the Dell Edge Gateway 3000 Series), we will see more and more analytic capabilities being pushed to the edge.
How Do You Start Your IOT Journey
While the rapidly evolving expertise on the IOT edge technologies can be very exciting (graphical processing units in gateway servers with embedded machine learning capabilities with 100’s of gigabytes of storage), the starting point for the IOT journey must first address this basic question:
How effective is your organization at leveraging data and analytics to power your business (or operational) models?
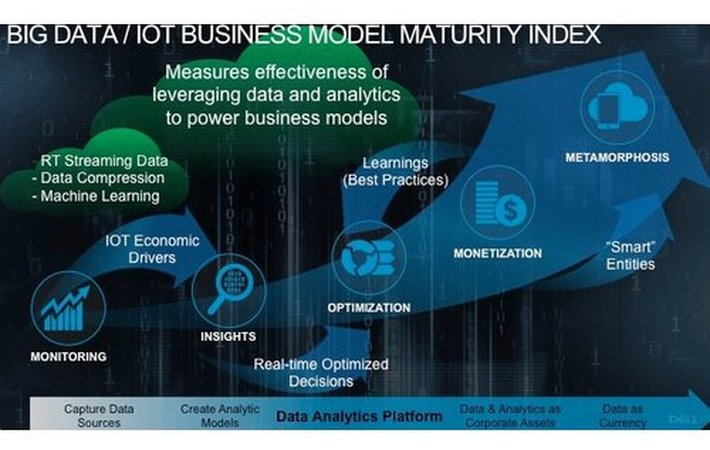
We have tweaked the Big Data Business Model Maturity Index to help organizations not only understand where they sit on the maturity index with respect to the above question, but also to provide a roadmap for how organizations can advance up the maturity index to become more effective at leveraging the wealth of IOT data with advanced analytics to power their business and operational models (see Figure 5).

Figure 5: Big Data / IOT Business Model Maturity IndexMaturity Index
To drive meaningful business impact, you will need to begin with the business and not the technology:
If you want to monetize your IOT initiatives, follow those simple guidelines and you will dramatically increase the probability of your business and monetization success.
For more details on the Internet of Things revolution, check out these blogs:
This article was originally published on LinkedIn.